PDF REPORT
The simulation result is provided in a PDF report and in a interactive 3D viewer. Its objective is to read the results of a case in an agile and detailed manner.
A copy is obtained from the detail of a completed case, which will always be available from the platform for visualization or download. Two studies are generated representing airflow: INSPIRATION and EXPIRATION.
This report provides quantitative information on the functionality of airflow in the nasal cavity of each patient. This information has to be taken as a support to the diagnosis that has to be substantiated in a computation of data and methodologies to give a better medical service to patients.
HOW TO ACCESS THE PDF REPORT?
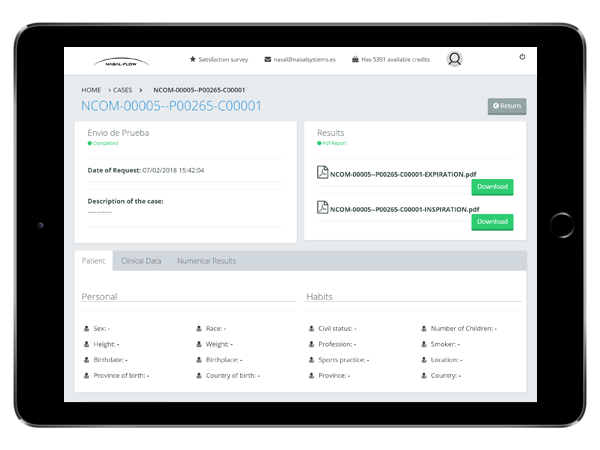
Once the requested case is completed, it will be available in your Case List for viewing and / or downloading the PDF Report. Follow the steps below to access the report.
STEP 1
From the NASAL FLOW desktop clicking CASES button.

STEP 2
In CASES section clicking the case number in the list. This report will be available when the status of the case is COMPLETED.
PASO 3
You can view or download the PDF Report by clicking on the DOWNLOAD button.

RESULTS OF THE STUDY
PDF report is composed of the following data.
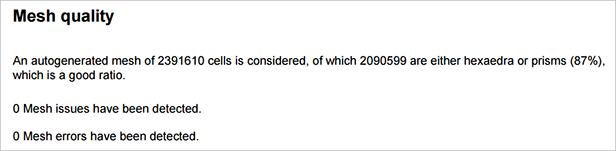
MESH QUALITY
Details the quality data of the obtained geometry to assess the reliability of the simulation result.
DESCRIPTIVE STATISTICS
The measurement values of the structure are detailed, like the Perimeter (cm) of the two entries (nostrils), the way out to the lower respiratory tract (nasopharynx).
Area (cm2) of the entries, outputs and the complete nasal cavity, as well as its total Volume (cm3).

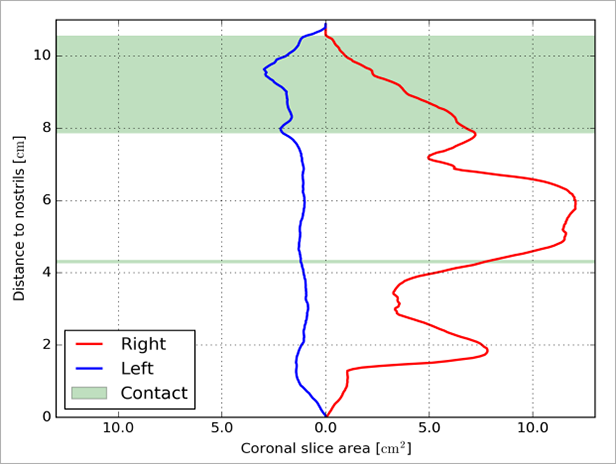
ACOUSTIC RHINOMETRY
A graph similar to an Acoustic Rinometry is represented, but not equivalent. More specifically, the area curves associated with the coronal sections of the nasal cavity are represented. The detected contacts between the left and right cavities are also represented.
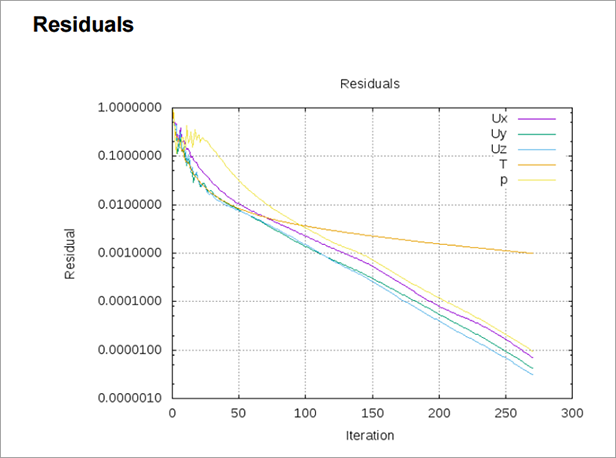
RESIDUALS CONVERGENCE
In this type of simulations the results they can be considered as an error indicator. All residuals is represented in a line. The results must be less than 0.001 at the end of the simulation. Otherwise, the simulation has not converged, so the results should not be considered valid.
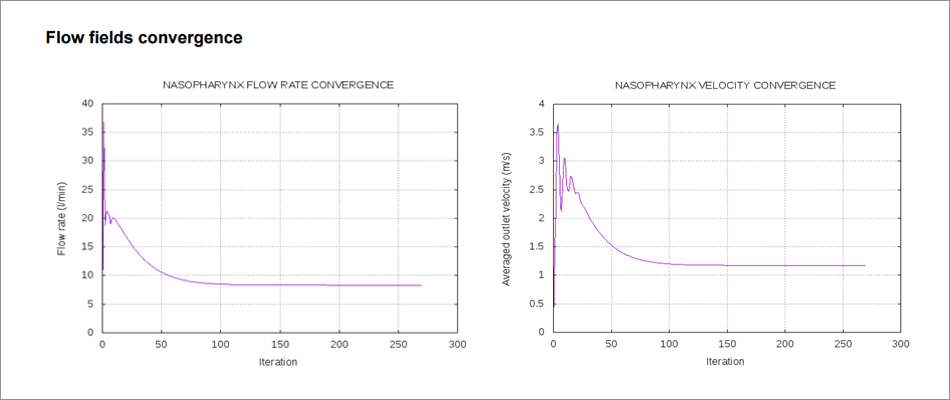
FLOW FIELDS CONVERGENCE
The flowrate an velocity they can also be tracked to check the convergence. The line represented in the graph must have a constant value at the end of the simulation.
SIMULATION RESULTS
PDF report contains the following results of the simulation.
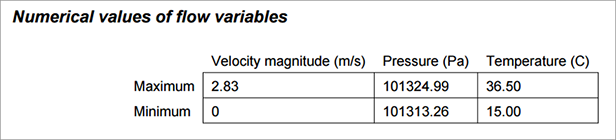
NUMERICAL VALUES OF FLOW VARIABLES
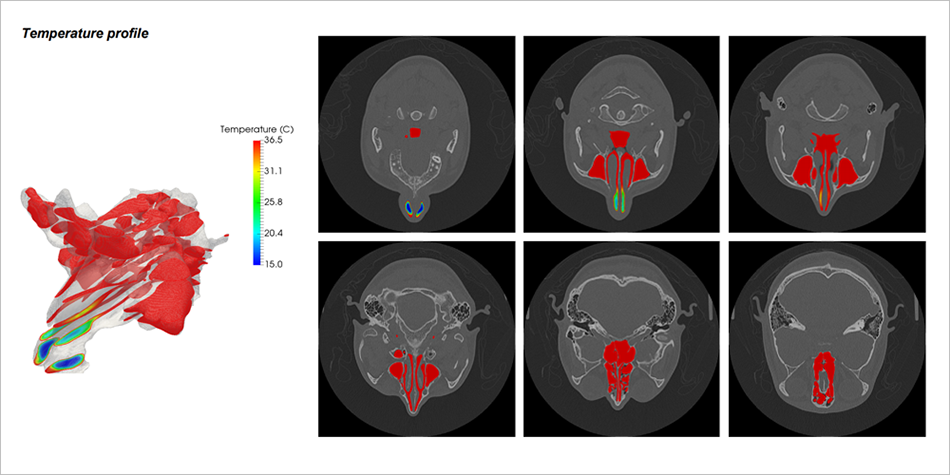
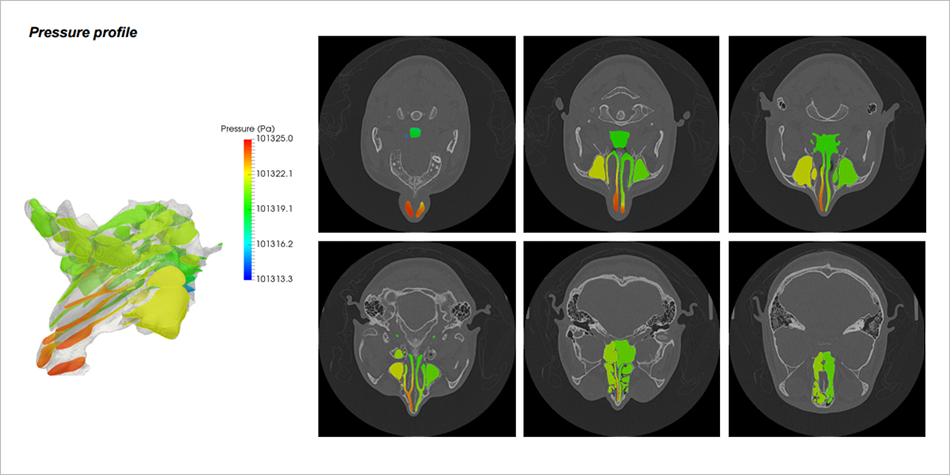
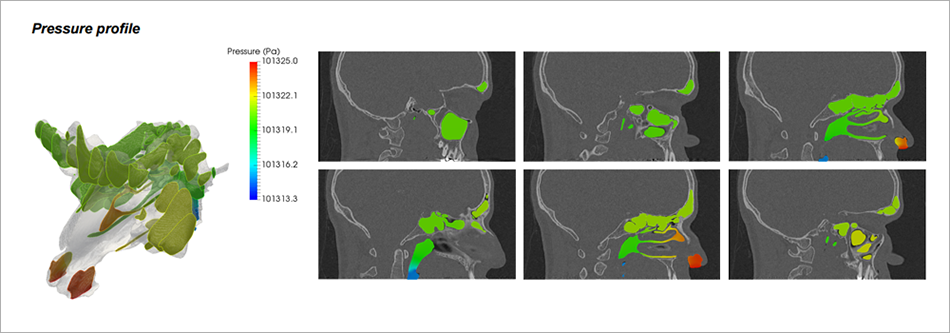
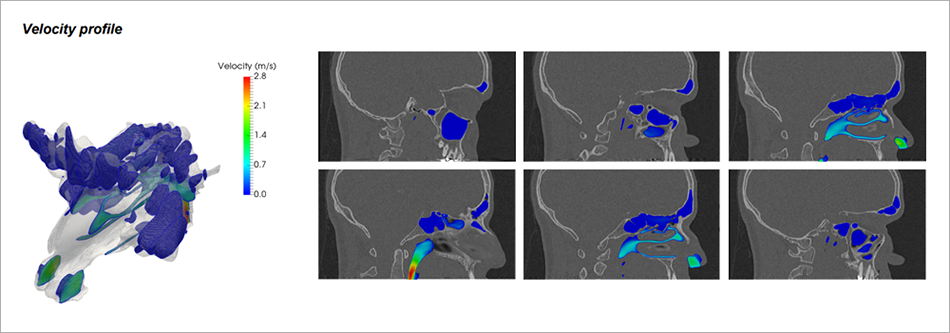
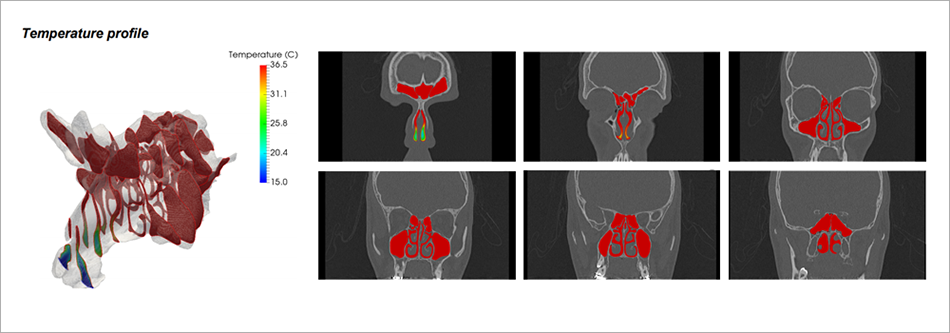
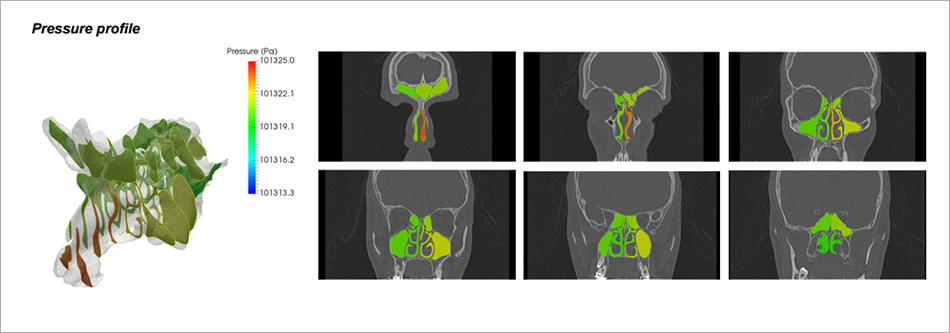
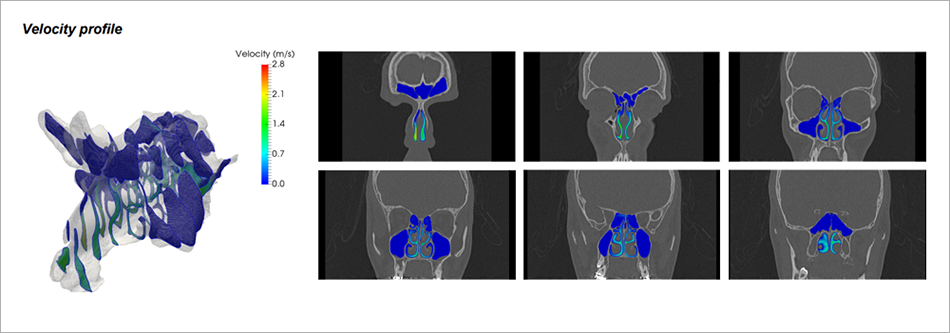
The maximum and minimum values of the variables of Velocity magnitude (m/s), Pressure (Pa) and Temperature (C).
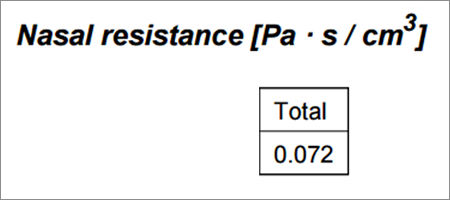
NASAL RESISTANCE
he measurement of Nasal resistance is detailed [Pa • s / cm3] in the total computation.
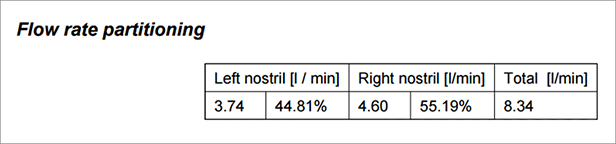
FLOW RATE PARTITIONING
The amount of fluid circulating through the nasal cavity is detailed per unit of time (l/m).
VARIABLES. PRESET CUTS
PDF report contains the following information.
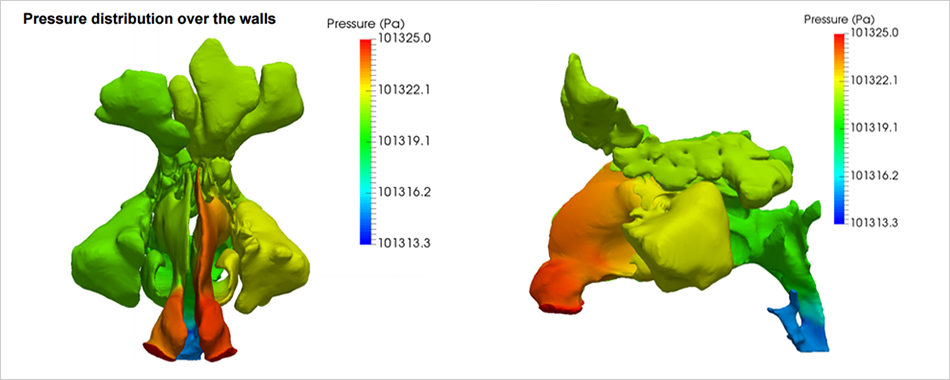
PRESSURE DISTRIBUTION OVER THE WALLS
It is represented, on the geometry of the anatomy, a colored mask that indicates the pressure values in the walls of the nasal cavity.
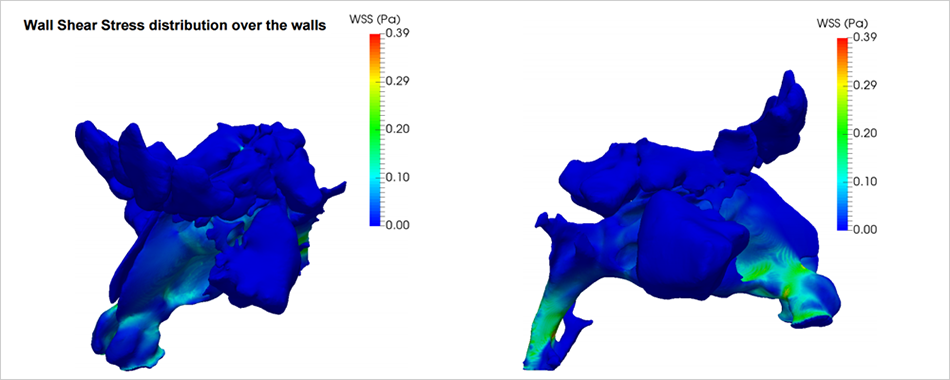
WALL SHEAR STRESS DISTRIBUTION OVER THE WALLS (WSS)
It is represented, on the geometry of the anatomy the stress areas by the friction of the flow in the walls of the nasal cavity.
STREAMLINES
This section shows the airflow current lines of the two sides in the nasal cavity representing speed values by means of «streamlines».